Stamping
Case Studies
Learn how stamping companies are using accurate structured blue light 3D scanners, comprehensive inspection software, photogrammetry technology, and/or automation to improve manufacturing processes with rapid precision measurements
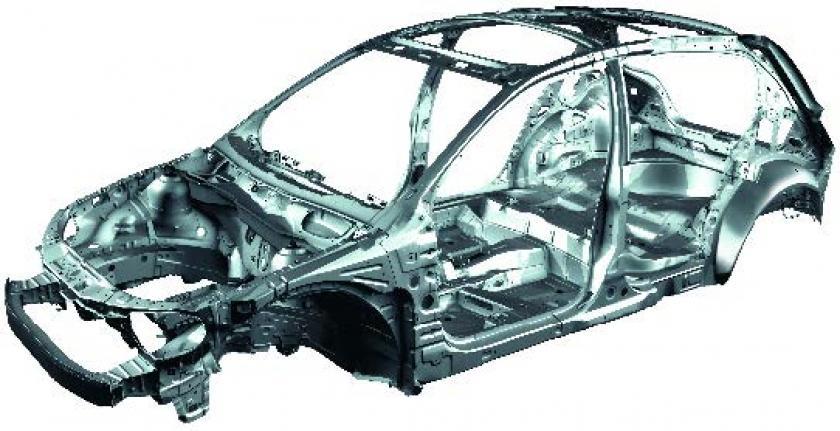
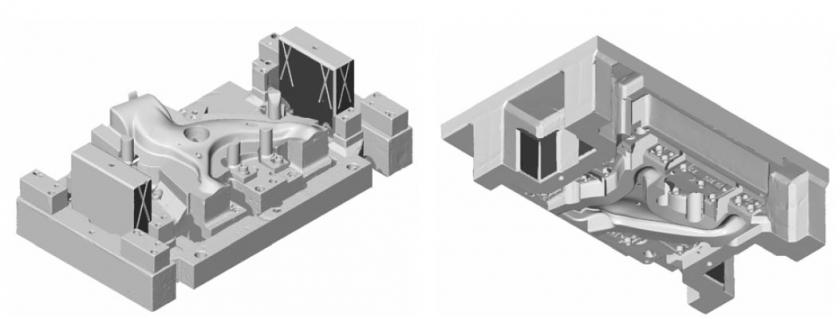
This presentation by Chrysler describes their die manufacturing process and how ATOS is utilized from product development to production for 3D scanning and inspection
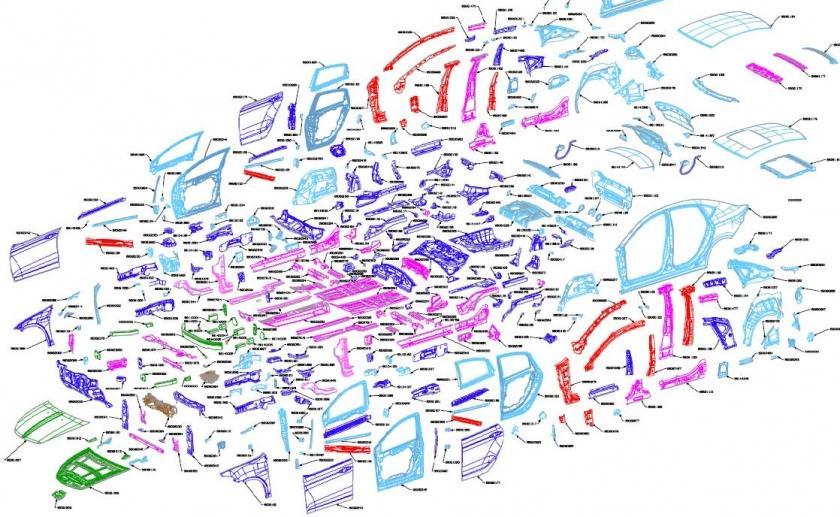
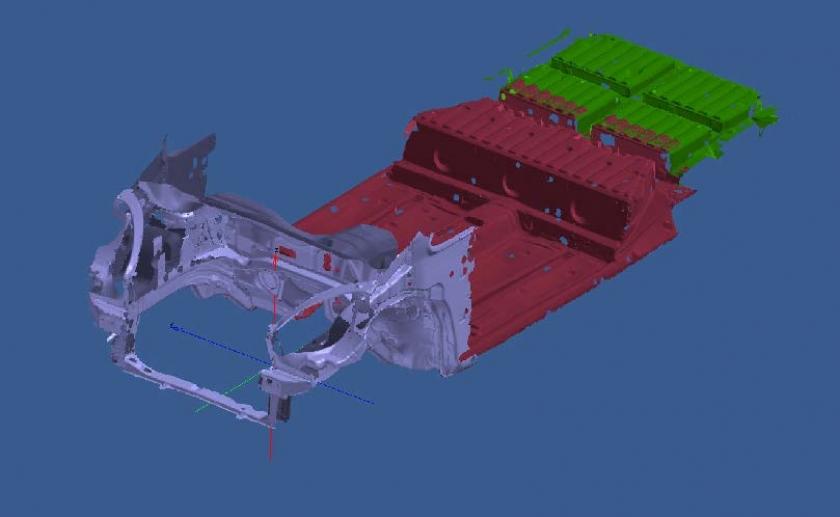
In automotive production, the individual parts are held in fixtures during mounting and are combined such that precise components and assemblies result. When using large…
This presentation will cover the strategic implementation of ATOS into Gedia's manufacturing process.
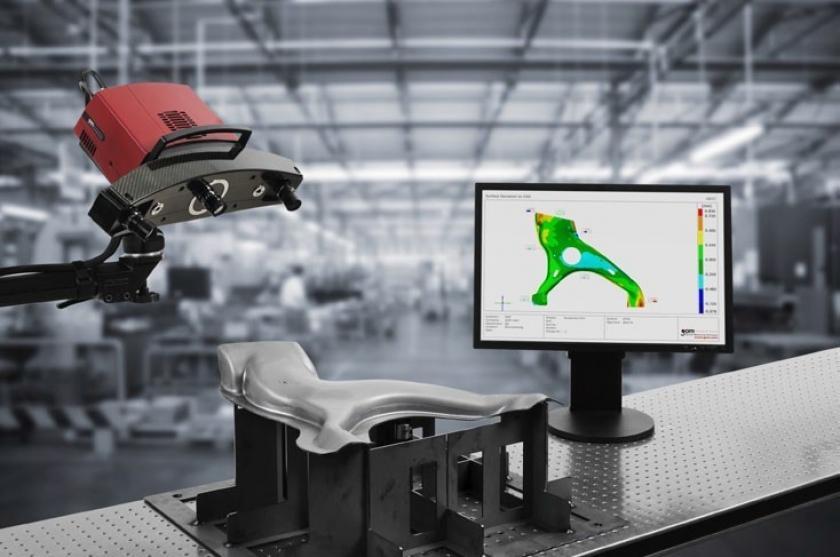
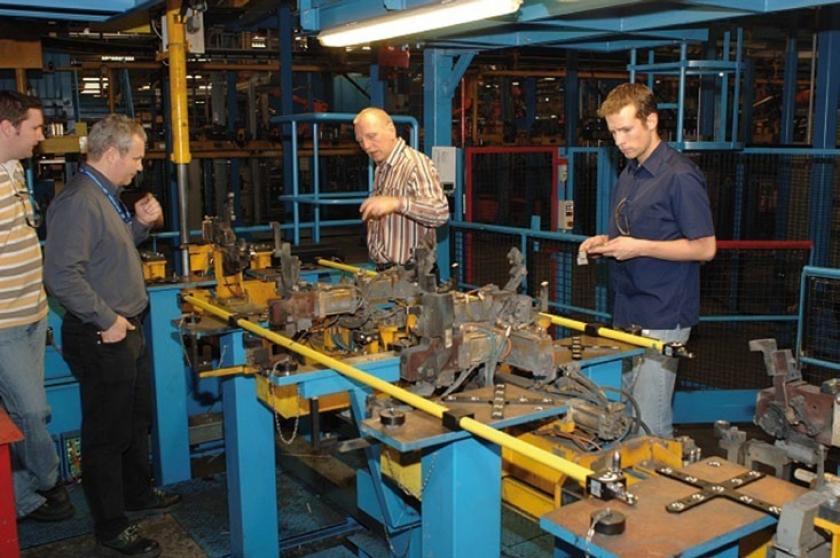
Quality assurance and management are growing in importance in industrial development and production. The decentralized production of components by suppliers mean that tight specifications have…
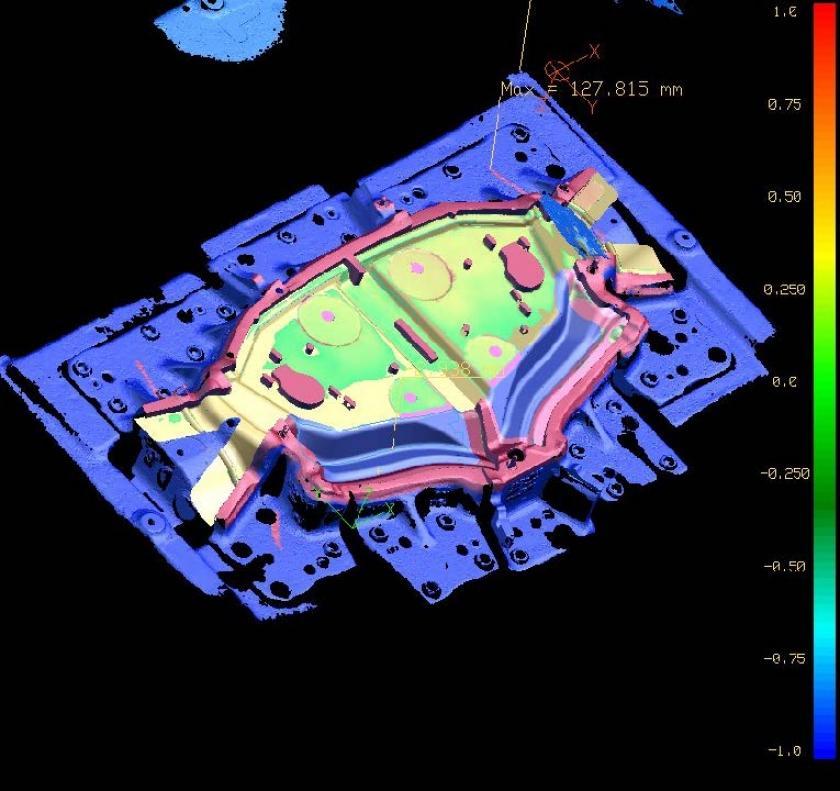
This presentation from 2007 covers how Infinity utilizes TRITOP and ATOS are used for sheet metal inspection and forming analysis.
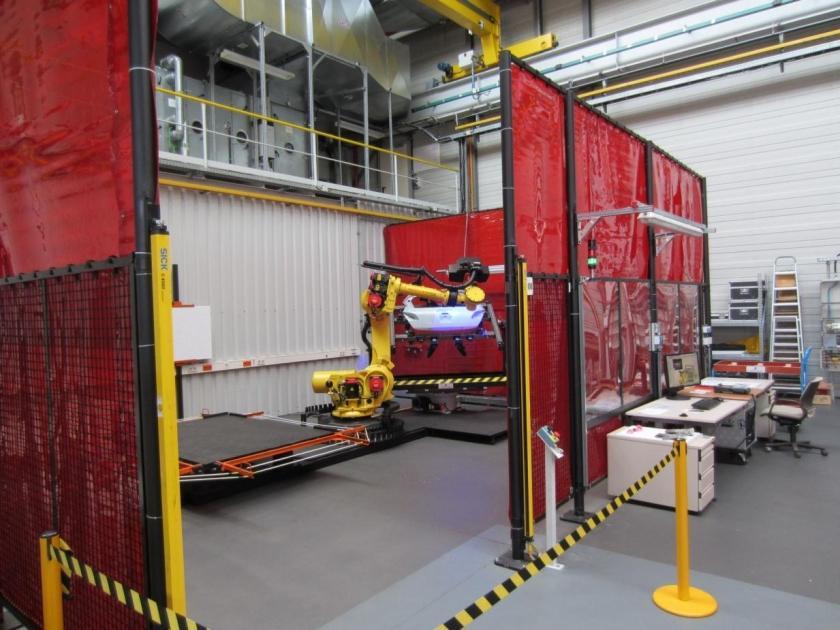
This presentation covers the history of ATOS 3D scanners at Opel's manufacturing facility and their progression to automated inspection for quality process improvement and higher…
This presentation delivered by Renault showcases varies examples of ATOS 3D scanning, TRITOP photogrammetry, and robotics to measure and analyze sheet metal and forming applications.
Simulation of forming processes has become an important tool for the current process optimization. It can be supported significantly by modern optical measuring methods based…