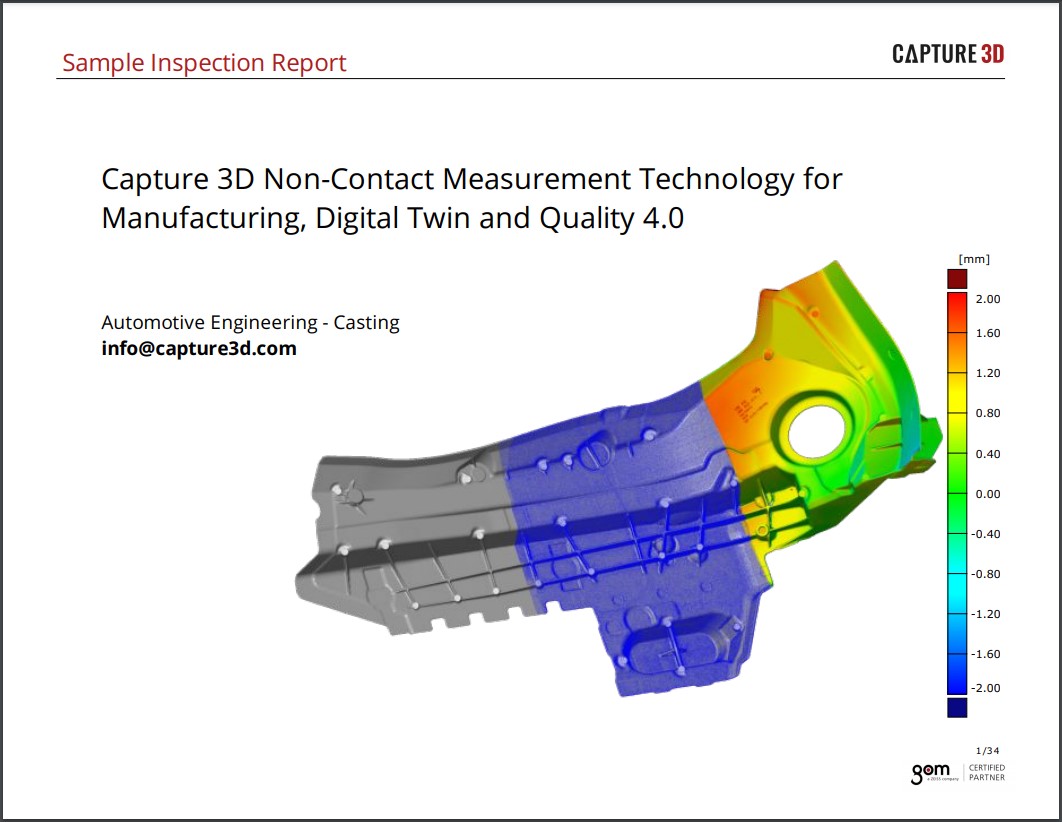
Getting Started with the GOM Software User Interface
GOM Software is a digital tool used in manufacturing to analyze and inspect measurement data from 3D scanners, laser scanners, handheld devices, and even CT. The software is a very powerful package, so it's important to know the location of all the tools to maximize its potential. Below, we've outlined the essential workspaces within the software and highlighted their unique features and functions. Save this blog as a reference to use any time you dive into a project in GOM Software, and keep reading below to learn more!
Basic Functions on the Main Screen of GOM Software
Upon opening the software, there are six different tiles on the screen. From left to right, there is New Project, which opens a blank project; Open Project, which opens saved projects; and Sample Data, which is a directory of canned projects you can save on your computer and use for demonstration purposes. Next is the Project Templates function, a function available with the professional version of GOM Software. Following is the Recently Used Projects button, which houses the projects you use frequently and recently. The final button is Get Started, which serves as a good information access point for new and advanced users by providing direct access to the GOM forum, the GOM website, the GOM Training Center, a list of Frequently Asked Questions, and knowledgebase articles.
How to Create a New Project in GOM Software
Begin by opening a blank project. There are various drop-down menus housed in a toolbar at the top of the screen, such as File, Edit, and View. This toolbar is static, meaning no matter what workspace you're in, these functions are always available. Directly below that, however, is the workspace toolbar with functions that change depending on the workspace. For this example, the inspection workspace is opened, and the workspace selection can be accessed by clicking on the button in the top left with three horizontal bars. Clicking that button also opens the inspection report and mesh editing workspace available in free GOM Inspect Software. These workspaces can be pinned or unpinned to make them easier to access. The Explorer is directly to the right, and next to that is the status bar, which reveals errors in your project. If you see it turn red, click on it to review its suggestions for improving the project.
There are currently no elements in the Explorer, so for this example, drag in some elements by bringing in the GOM block's CAD model. To do this, open the folder and drag and drop it into the software. Clicking on the New Part button adds it to a new part. Then, in the Explorer, hit Okay for the CAD parameters, and now the CAD model is in the Explorer with its local coordinate system and some associated tags. Notice each model populates in the Explorer as it is brought into the space. Everything that's built or brought into the software is available in Explorer. Directly below the Explorer is the sub-Explorer, which is an organizational function of the Explorer. Right now, the Relates To tab is open, so everything selected that is related to the CAD can be seen in the sub-Explorer.
The Viewing Cube is in the bottom left. Clicking on the axes of the arrows and bits of the cube allows you to move the part around to see it from different angles. Some helpful mouse functions are available, such as using the left mouse button to rotate the part, using the middle wheel to pan, using the middle wheel's scroll to zoom in or out, and the right-click button is a menu option.
Further along, down the bottom of the software is a gray toolbar and functions in red which are 3D selection tools typically used when selecting mesh data, but in this case, they can also be used to grab some bits of CAD data. Along the right side of the screen, there are double arrows that pop out. Moving your mouse over those arrows pulls out the Properties menu, which tells you information about any of the models or inspections you have selected in the Explorer. For this example, you will see the breakdown of the workspace, including the nominal part, CAD model, and details like the part's number of points (209,000 points in this example).
Along the top right corner of the screen is the Packages selection, which is limited in the free version of the software, but in the professional version of the software, it allows for a lot of manipulation. Directly to the right of that is the Direct Help menu that helps with locating different software functions. For example, typing in "surface comparison" brings up the Direct Help menu for surface comparison. Alternatively, if you ever have a dialog box open and see a question mark appear in the top right corner, clicking on it will also bring you to its associated Direct Help menu. Using the Direct Help menu is very helpful if you're stuck on a function because it provides information such as how to use it, when to use it, and why to use it.
In the top right corner, there are three icons. The training icon brings you to the GOM Training Center. Then there is the GOM ID button and license information that you can click on to create a GOM ID and get a temporary license to try the software's professional version. The professional version of the software provides additional features that make it a much more robust software. The final button in this row is the Open GOM website function that brings you to the GOM website, training center, support area, and other helpful resources.
Functions in the Reporting Workspace of GOM Software
Next, flip from the current workspace (the inspection workspace) to the reporting workspace by hitting the button below the magnifying glass on the screen's left side. The colored bar on the top, and some of its functions, will change to become specific to the reporting workspace. This basic reporting workspace contains the Explorer space with a sub-explorer area below where you can click and drag items from the Explorer area into the sub-explorer area to create report pages. On the far right is the Properties menu with functions that remain mostly consistent when moving from workspace to workspace.
Finally, navigate to the mesh editing workspace by clicking on the button two down from the magnifying glass on the left. In this workspace, the colored bar on the top changes, and some of the functions below that change, but otherwise, the software's functions remain consistent.
How to Get Started with GOM Software
By understanding the user interface, it's easy to create a new project and navigate through different workspaces. Then, by understanding what each workspace and function does, manipulating inspection elements and generating inspection reports becomes a quick and easy process. The features and functions highlighted in this tutorial are just a glimpse into the capabilities of GOM Software, so if you're ready to learn more about how GOM Software can improve your inspection reporting, contact a Capture 3D team member today! Our experts are happy to help you get started with GOM Software and ATOS technologies.